


Using Social Media Metrics to Track Your Organization's Impact
For many HIV organizations, evaluating how well we’re using our communication channels is an essential part of assessing our success. But, when it comes to metrics, it seems like there are endless data points to track and countless metric tools to consider.
To help understand what really matters when it comes to metrics and tracking, we asked our colleague, Chief Whaler George Weiner of Whole WhaleExit Disclaimer, a social impact digital agency, to provide some insights and learnings from their work with clients including Greater than AIDS. Below is Part 1 of a 2-part conversation with George on social media metrics.
How can an organization decide which metrics are more or less important to track over time?
This is an important question, and one that requires a multi-part answer.
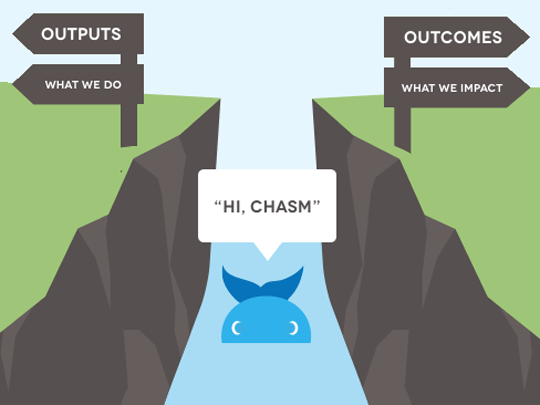
Picture a chasm. On one side, there is the digital marketing, communication, and content work your organization does on a daily basis, and, on the other side, are long-term societal benefits. While there are concrete outputs being created like emails and online content, how can you tell if this work is moving the needle on long-term impact?
The most common answer to this is usually some digital vanity metric, which includes page views, sessions, likes, or followers. A vanity metric is a number that may present the appearance of large-scale reach but ultimately holds low relevance to real impact and is not a best practice. The key to avoiding these vanity metrics is to define predictive indicators that connect to real action.
Consider the following questions:
- Why does your organization have a website?
- Are your digital-marketing and content-marketing initiatives driving users to spend time or take trackable actions (e.g., viewing your FAQ pageExit Disclaimer, downloading outreach materialsExit Disclaimer, or signing up for your newsletter)?
- How do you know if your website is driving your intended offline impact (e.g., more people asking their doctors about PrEPExit Disclaimer, or more people getting tested for HIVExit Disclaimer)?
These are important questions you should be able to answer and, more importantly, measure. Once the larger inputs, outputs, and outcomes of the organization have been defined, we use a digital impact-mapping process to help give context and relative value to metrics and data points. In this context, social likes can be built into the narrative and not be seen as just a vanity metric — assuming that they actually relate to the outcome your funnel points toward.
Make sure that the metrics aligned with your inputs, outputs, and outcomes are SMART:
- Specific
- Measurable
- Actionable
- Relevant
- Time-bound
If your goal is to raise awareness about your organization or specific content on your website, “awareness” alone is not necessarily measurable. Organic website traffic (as opposed to paid ads), however, is measurable and a good predictive indicator that awareness is rising. This is also something you can track in Google Analytics, in a dashboardExit Disclaimer and/or as a Google Analytics goalExit Disclaimer.
We plot these indicators against four levels of engagement to help track next-step actions:
- Awareness
- Engagement
- Action
- Commitment

Picture a funnel with the widest part — the top — being the Awareness and the narrowest part as the change you want to see in the world. Tracking metrics in this manner speaks to the fact that not every user will go from aware all the way down to committed. It also allows you to more easily see where you may be getting “holes” in the funnel. For instance, if organic website sessions are an indicator of awareness, and a goal for 5 minutes or more spent on the site is one that is set for interest, but you’re losing users between these two metrics at a disproportionate rate, that gives you something specific, measurable, and actionable — you can make adjustments to your content, or check to see if something on your site is preventing users from staying longer (e.g., a page-loading issue).
This is a (relatively) quick recap of a theoretical framework for nonprofit impactExit Disclaimer that we could dedicate full articles to (and have!), but it’s an important foundation to build on because knowing why you’re choosing one metric over another will also help you understand when to pivot, and what to focus on in, say, 5 years.
For HIV organizations, your ultimate, moving-the-needle-forward goal may be around the number of individuals getting tested or using PrEP. Supporting metrics we recommend tracking in Google Analytics include: email signups; interested users (both the number of users who view more than 3 pages per session and the number of users who spend more than 5 minutes on-site); and shares of key pages to social media. If you offer resources for download or a searchable resource that allows users to find nearby testing facilities based on ZIP code, you can track these downloads and searches as well.
With Greater Than AIDS (GTA), we can track when users are searching for health providers in their area, when and where they watch videos, when they click out to partner websites, and when they download promotional materials. All of this enables the GTA team to improve the digital experience over time for their users, and helps us to measure the success of their advertising.
Stay tuned for Part 2 of this conversation, coming soon. If you’re not already subscribed to our email lists, sign up today to get our latest articles delivered to your inbox.